File:Shell-diag-1.png
跳转到导航
跳转到搜索
本预览的尺寸:800 × 386像素。 其他分辨率:320 × 154像素 | 640 × 309像素 | 1,255 × 605像素。
原始文件 (1,255 × 605像素,文件大小:33 KB,MIME类型:image/png)

|
File:Shell-diag-1.svg是此文件的矢量版本。 如果此文件质量不低于原点阵图,就应该将这个PNG格式文件替换为此文件。
File:Shell-diag-1.png → File:Shell-diag-1.svg
更多信息请参阅Help:SVG/zh。 |
 |
摘要
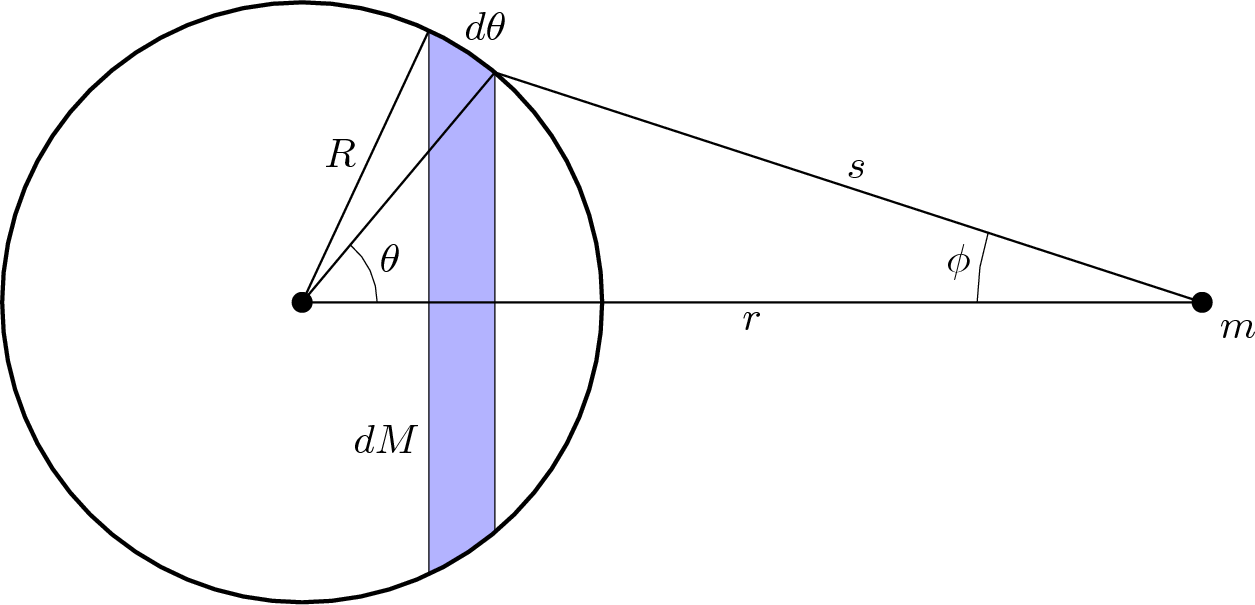
| 描述 | A diagram illustrating the derivation of Newton's shell theorem. Shown is a thin shell with a test mass outside the shell (). |
| 日期 | |
| 来源 | 自己的作品 |
| 作者 | Jim Wisniewski |

许可协议
我,本作品著作权人,特此采用以下许可协议发表本作品:
本文件采用知识共享署名-相同方式共享 2.5 通用许可协议授权。
- 您可以自由地:
- 共享 – 复制、发行并传播本作品
- 修改 – 改编作品
- 惟须遵守下列条件:
- 署名 – 您必须对作品进行署名,提供授权条款的链接,并说明是否对原始内容进行了更改。您可以用任何合理的方式来署名,但不得以任何方式表明许可人认可您或您的使用。
- 相同方式共享 – 如果您再混合、转换或者基于本作品进行创作,您必须以与原先许可协议相同或相兼容的许可协议分发您贡献的作品。
Source
This image and the others in the same series (2, 3, 4) were generated from the MetaPost code presented below. The code is released under the same license as the images themselves.
% shell-diag.mp
% A diagram illustrating the derivation of Newton's shell theorem.  To be
% processed with MetaPost.

color bandshade, fillshade;
bandshade = 0.7 [blue, white];
fillshade = 0.9 white;

numeric dotsize, deg;
dotsize = 5 bp;
deg = length( fullcircle )/360;

freelabeloffset := 3/4 freelabeloffset;
labeloffset := 2 labeloffset;

def dot( expr P ) =
  fill fullcircle scaled dotsize shifted P withcolor black;
enddef;

def draw_circle( expr R, stroke ) =
  save p;
  pen p;
  p = currentpen;
  pickup p scaled stroke;
  draw fullcircle scaled 2R;
  pickup p;
enddef;

vardef anglebetween( expr a, b, rad, str ) =
  save endofa, endofb, common, curve, where;
  pair endofa, endofb, common;
  path curve;
  numeric where;
  endofa = point length( a ) of a;
  endofb = point length( b ) of b;
  if round point 0 of a = round point 0 of b:
    common = point 0 of a;
  else:
    common = a intersectionpoint b;
  fi;
  where = turningnumber( common--endofa--endofb--cycle );
  curve = (unitvector( endofa - common ){(endofa - common) rotated (90 * where)} ..
           unitvector( endofb - common )) scaled rad shifted common;
  draw thefreelabel( str, point 1/2 of curve, common ) withcolor black;
  curve
enddef;

def draw_angle( expr a, b, rad, str ) =
  begingroup
    save p;
    pen p;
    p = currentpen;
    pickup p scaled 1/2;
    draw anglebetween( a, b, rad, str );
    pickup p;
  endgroup
enddef;

def label_line( expr a, b, disp, str ) =
  begingroup
  save mid, opp;
  pair mid, opp;
  mid = 1/2 [a, b];
  opp = -disp rotated (angle( b - a ) - 90) shifted mid;
  draw thefreelabel( str, mid, opp );
  draw a -- b;
  endgroup
enddef;

def draw_thinshell( expr R, r, theta, dtheta, thetarad, phirad ) =
  begingroup
    save M, m;
    pair M, m;
    M = (0, 0);
    m = (r, 0);

    save circ;
    path circ;
    circ = fullcircle scaled 2R;

    save thetapt, dthetapt;
    pair thetapt, dthetapt;
    thetapt   = point (theta * deg) of circ;
    dthetapt  = point ((theta + dtheta) * deg) of circ;

    save upper, lower, band;
    path upper, lower, band;
    upper = subpath (0, 4) of circ;
    lower = subpath (4, 8) of circ;
    band = buildcycle( upper, (xpart thetapt,  R) -- (xpart thetapt,  -R),
                       lower, (xpart dthetapt, R) -- (xpart dthetapt, -R) );

    % draw figures
    save p;
    pen p;
    p = currentpen;
    pickup p scaled 1/2;
    fill band withcolor bandshade;
    draw band;
    pickup p;

    save near, far;
    pair near, far;
    if theta < 90:
      near = 3/4[ulcorner band, llcorner band];
      far  = right shifted near;
    else:
      near = 3/4[urcorner band, lrcorner band];
      far  = left shifted near;
    fi;
    draw thefreelabel( btex $dM$ etex, near, far );

    dot( M );
    %label.llft( btex $M$ etex, M );

    dot( m );
    label.lrt( btex $m$ etex, m );

    draw M -- thetapt;
    label_line( M, m, right, btex $r$ etex );
    label_line( m, thetapt, right, btex $s$ etex );
    if R <> r:
      label_line( M, dthetapt, left, btex $R$ etex );
    else:
      draw M -- dthetapt;
    fi;

    draw_angle( m -- M, m -- thetapt, phirad, btex $\phi$ etex );
    draw_angle( M -- m, M -- thetapt, thetarad, btex $\theta$ etex );
    draw_angle( M -- thetapt, M -- dthetapt, R, btex $d\theta$ etex );
  endgroup
enddef;

def draw_thickshell( expr Ra, Rb, r ) =
  begingroup
    save m;
    pair m;
    m = (r, 0);

    fill fullcircle scaled 2Rb withcolor fillshade;
    fill fullcircle scaled 2r  withcolor bandshade;
    unfill fullcircle scaled 2Ra;

    dot( origin );
    dot( m );
    label.lrt( btex $m$ etex, m );
    label_line( origin, m, right, btex $r$ etex );

    draw_circle( Rb, 2 );
    if Ra > 0:
      draw_circle( Ra, 2 );
      label_line( origin, dir( 100 ) scaled Rb, left,  btex $R_b$ etex );
      label_line( origin, dir( 80 )  scaled Ra, right, btex $R_a$ etex );
    else:
      label_line( origin, dir( 90 )  scaled Rb, left,  btex $R_b$ etex );
    fi;
  endgroup
enddef;

% Thin shell, r > R
beginfig(1)
  numeric R;
  R = 1 in;
  draw_thinshell( R, 3R, 50, 15, 1/4 in, 3/4 in );
  draw_circle( R, 2 );
endfig;

% Thin shell, r < R
beginfig(2)
  numeric R;
  R = 1 in;
  draw_thinshell( R, 0.7R, 125, 15, 1/8 in, 1/3 in );
  draw_circle( R, 2 );
endfig;

% Thick shell
beginfig(3)
  numeric Ra, Rb, r;
  Ra = 0.8 in;
  Rb = 1.3 in;
  r = 1 in;

  draw_thickshell( Ra, Rb, r );
endfig;

% Solid sphere
beginfig(4)
  numeric Ra, Rb, r;
  Ra = 0;
  Rb = 1.3 in;
  r = 1 in;

  draw_thickshell( Ra, Rb, r );
endfig;

end
文件历史
点击某个日期/时间查看对应时刻的文件。
| 日期/时间 | 缩略图 | 大小 | 用户 | 备注 | |
|---|---|---|---|---|---|
| 当前 | 2006年9月30日 (六) 01:50 | | 1,255 × 605(33 KB) | wikimediacommons>Xaonon | == Summary == {{Information |Description = A diagram illustrating the derivation of Newton's shell theorem. Shown is a thin shell with a test mass outside the shell (<math>r > R</math>). Created with w:MetaPost. |Source = Own work. |Date = 2006-09-2 |
文件用途
以下页面使用本文件: