File:Pi 30K.gif
跳转到导航
跳转到搜索
没有更高的分辨率。
Pi_30K.gif (500 × 500像素,文件大小:476 KB,MIME类型:image/gif、循环、10帧、2.0秒)
摘要
| 描述 |
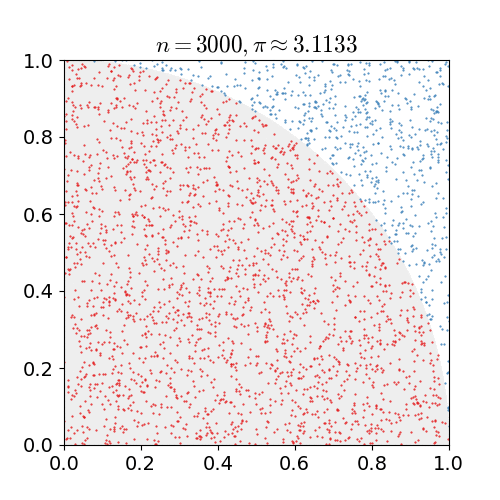
English: As points are randomly scattered inside the unit square, some fall within the unit circle. The fraction of points inside the circle over all points approaches pi/4 as the number of points goes toward infinity. This animation represents this method of computing pi out to 30,000 iterations.
Português: Conforme os pontos são espalhados aleatoriamente no quadrado unitário, alguns caem dentro do círculo unitário. A fração de pontos dentro do círculo sobre todos os pontos se aproxima de pi/4 à medida que o número de pontos tende ao infinito. Essa animação representa esse método de cálculo de pi até 30 000 iterações. |
| 来源 | 自己的作品 |
| 作者 | nicoguaro |
| 源代码 | Python codefrom __future__ import division
import numpy as np
import matplotlib.pyplot as plt
import matplotlib.patches as mpatches
import matplotlib.animation as animation
from matplotlib import rcParams
# In Windows the next line should provide the full path to convert.exe
# since convert is a Windows command
#rcParams['animation.convert_path'] = "C:\Program Files\ImageMagick-6.9.3\convert.exe"
rcParams['mathtext.fontset'] = 'cm'
rcParams['font.size'] = 14
red = "#e41a1c"
blue = "#377eb8"
gray = "#eeeeee"
def update(n):
ax.cla()
pts = np.random.uniform(low=0, high=1, size=(2, n))
circ = pts[:, pts[0, :]**2 + pts[1, :]**2 <= 1]
out_circ = pts[:, pts[0, :]**2 + pts[1, :]**2 > 1]
pi_approx = 4*circ.shape[1]/n
circle = mpatches.Wedge((0, 0), 1, 0, 90, color=gray)
ax.add_artist(circle)
plt.plot(circ[0, :], circ[1, :], marker='.', markersize=1,
linewidth=0, color=red)
plt.plot(out_circ[0, :], out_circ[1, :], marker='.',markersize=1,
linewidth=0, color=blue)
plt.title(r"$n = {}, \pi \approx {:.4f}$".format(n, pi_approx))
plt.axis("square")
plt.xlim(0, 1)
plt.ylim(0, 1)
nvec = np.round(np.logspace(2, 5, 10))
nvec = [3000, 4000, 5000, 6500, 8500, 10000, 15000, 18000, 24000, 30000]
fig = plt.figure(figsize=(5, 5))
ax = fig.add_subplot(111)
ani = animation.FuncAnimation(fig, update, frames=nvec, blit=False)
ani.save("monte_carlo_pi.gif", writer='imagemagick',
savefig_kwargs={'delay': 6})
|
许可协议
我,本作品著作权人,特此采用以下许可协议发表本作品:
本文件采用知识共享署名 3.0 未本地化版本许可协议授权。
- 您可以自由地:
- 共享 – 复制、发行并传播本作品
- 修改 – 改编作品
- 惟须遵守下列条件:
- 署名 – 您必须对作品进行署名,提供授权条款的链接,并说明是否对原始内容进行了更改。您可以用任何合理的方式来署名,但不得以任何方式表明许可人认可您或您的使用。
文件历史
点击某个日期/时间查看对应时刻的文件。
| 日期/时间 | 缩略图 | 大小 | 用户 | 备注 | |
|---|---|---|---|---|---|
| 当前 | 2017年2月16日 (四) 17:00 | | 500 × 500(476 KB) | wikimediacommons>Nicoguaro | Make the plot square and increase gif delay. |
文件用途
以下页面使用本文件: