File:Pcm.svg
跳转到导航
跳转到搜索

此SVG文件的PNG预览的大小:500 × 375像素。 其他分辨率:320 × 240像素 | 640 × 480像素 | 1,024 × 768像素 | 1,280 × 960像素 | 2,560 × 1,920像素。
原始文件 (SVG文件,尺寸为500 × 375像素,文件大小:21 KB)
摘要
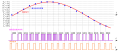
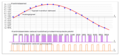
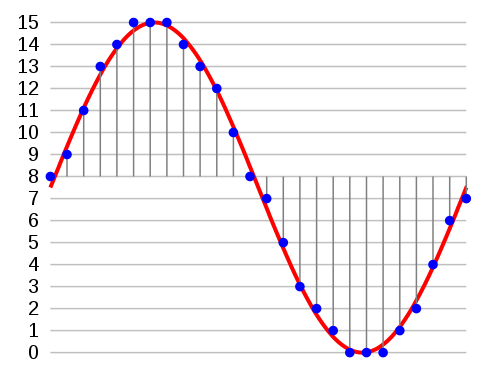
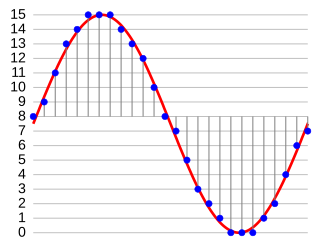
An example of 4-bit pulse code modulation (16 different binary-coded possibilities) showing quantization and sampling of a signal (red). Generated by myself using Inkscape to heavily modify gnuplot output.
See: 4-bit-linear-PCM.svg
Details
Generated curve and scale with the following gnuplot script:
源代码
Gnuplot code
set terminal svg size 1600 1200 fname "Times New Roman" fsize 48 enhanced
 set output "pcm.svg"
 set samples 1000

 set nokey
 set grid ytics lw 4
 set xtics 32
 set mxtics 32
 set ytics 1
 set noxzeroaxis
 set noyzeroaxis
 set noborder

 set xrange [0:32]
 set yrange [0:15]

 plot 7.5*sin(2*pi*x/32) + 7.5 lw 4
Floor function was then performed by hand in Inkscape, along with various other image quality tweaks.
Other versions
[]
.svg:
-
 俄语 .svg
 -
 Chinese (China) .svg
 -
 Chinese (Taiwan) .svg
 -
 int .svg


.png:
-
 爱沙尼亚语 .png
 -
 英语 .png

许可协议
我,本作品著作权人,特此采用以下许可协议发表本作品:

|
已授权您依据自由软件基金会发行的无固定段落及封面封底文字(Invariant Sections, Front-Cover Texts, and Back-Cover Texts)的GNU自由文件许可协议1.2版或任意后续版本的条款,复制、传播和/或修改本文件。该协议的副本请见“GNU Free Documentation License”。 |
| 本文件采用知识共享署名-相同方式共享 3.0 未本地化版本许可协议授权。 | ||
| ||
| 本许可协议标签作为GFDL许可协议更新的组成部分被添加至本文件。 |
- 您可以自由地:
- 共享 – 复制、发行并传播本作品
- 修改 – 改编作品
- 惟须遵守下列条件:
- 署名 – 您必须对作品进行署名,提供授权条款的链接,并说明是否对原始内容进行了更改。您可以用任何合理的方式来署名,但不得以任何方式表明许可人认可您或您的使用。
- 相同方式共享 – 如果您再混合、转换或者基于本作品进行创作,您必须以与原先许可协议相同或相兼容的许可协议分发您贡献的作品。
您可以选择您需要的许可协议。
文件历史
点击某个日期/时间查看对应时刻的文件。
| 日期/时间 | 缩略图 | 大小 | 用户 | 备注 | |
|---|---|---|---|---|---|
| 当前 | 2014年3月23日 (日) 21:51 | | 500 × 375(21 KB) | wikimediacommons>Aquegg~commonswiki | Use 'lollipop' notation, per Lyons, "Understanding DSP", 2001 |
文件用途
以下页面使用本文件: