File:Maximum Subarray Visualization.svg
跳转到导航
跳转到搜索

此SVG文件的PNG预览的大小:400 × 300像素。 其他分辨率:320 × 240像素 | 640 × 480像素 | 1,024 × 768像素 | 1,280 × 960像素 | 2,560 × 1,920像素。
原始文件 (SVG文件,尺寸为400 × 300像素,文件大小:2 KB)
摘要
| 描述 |
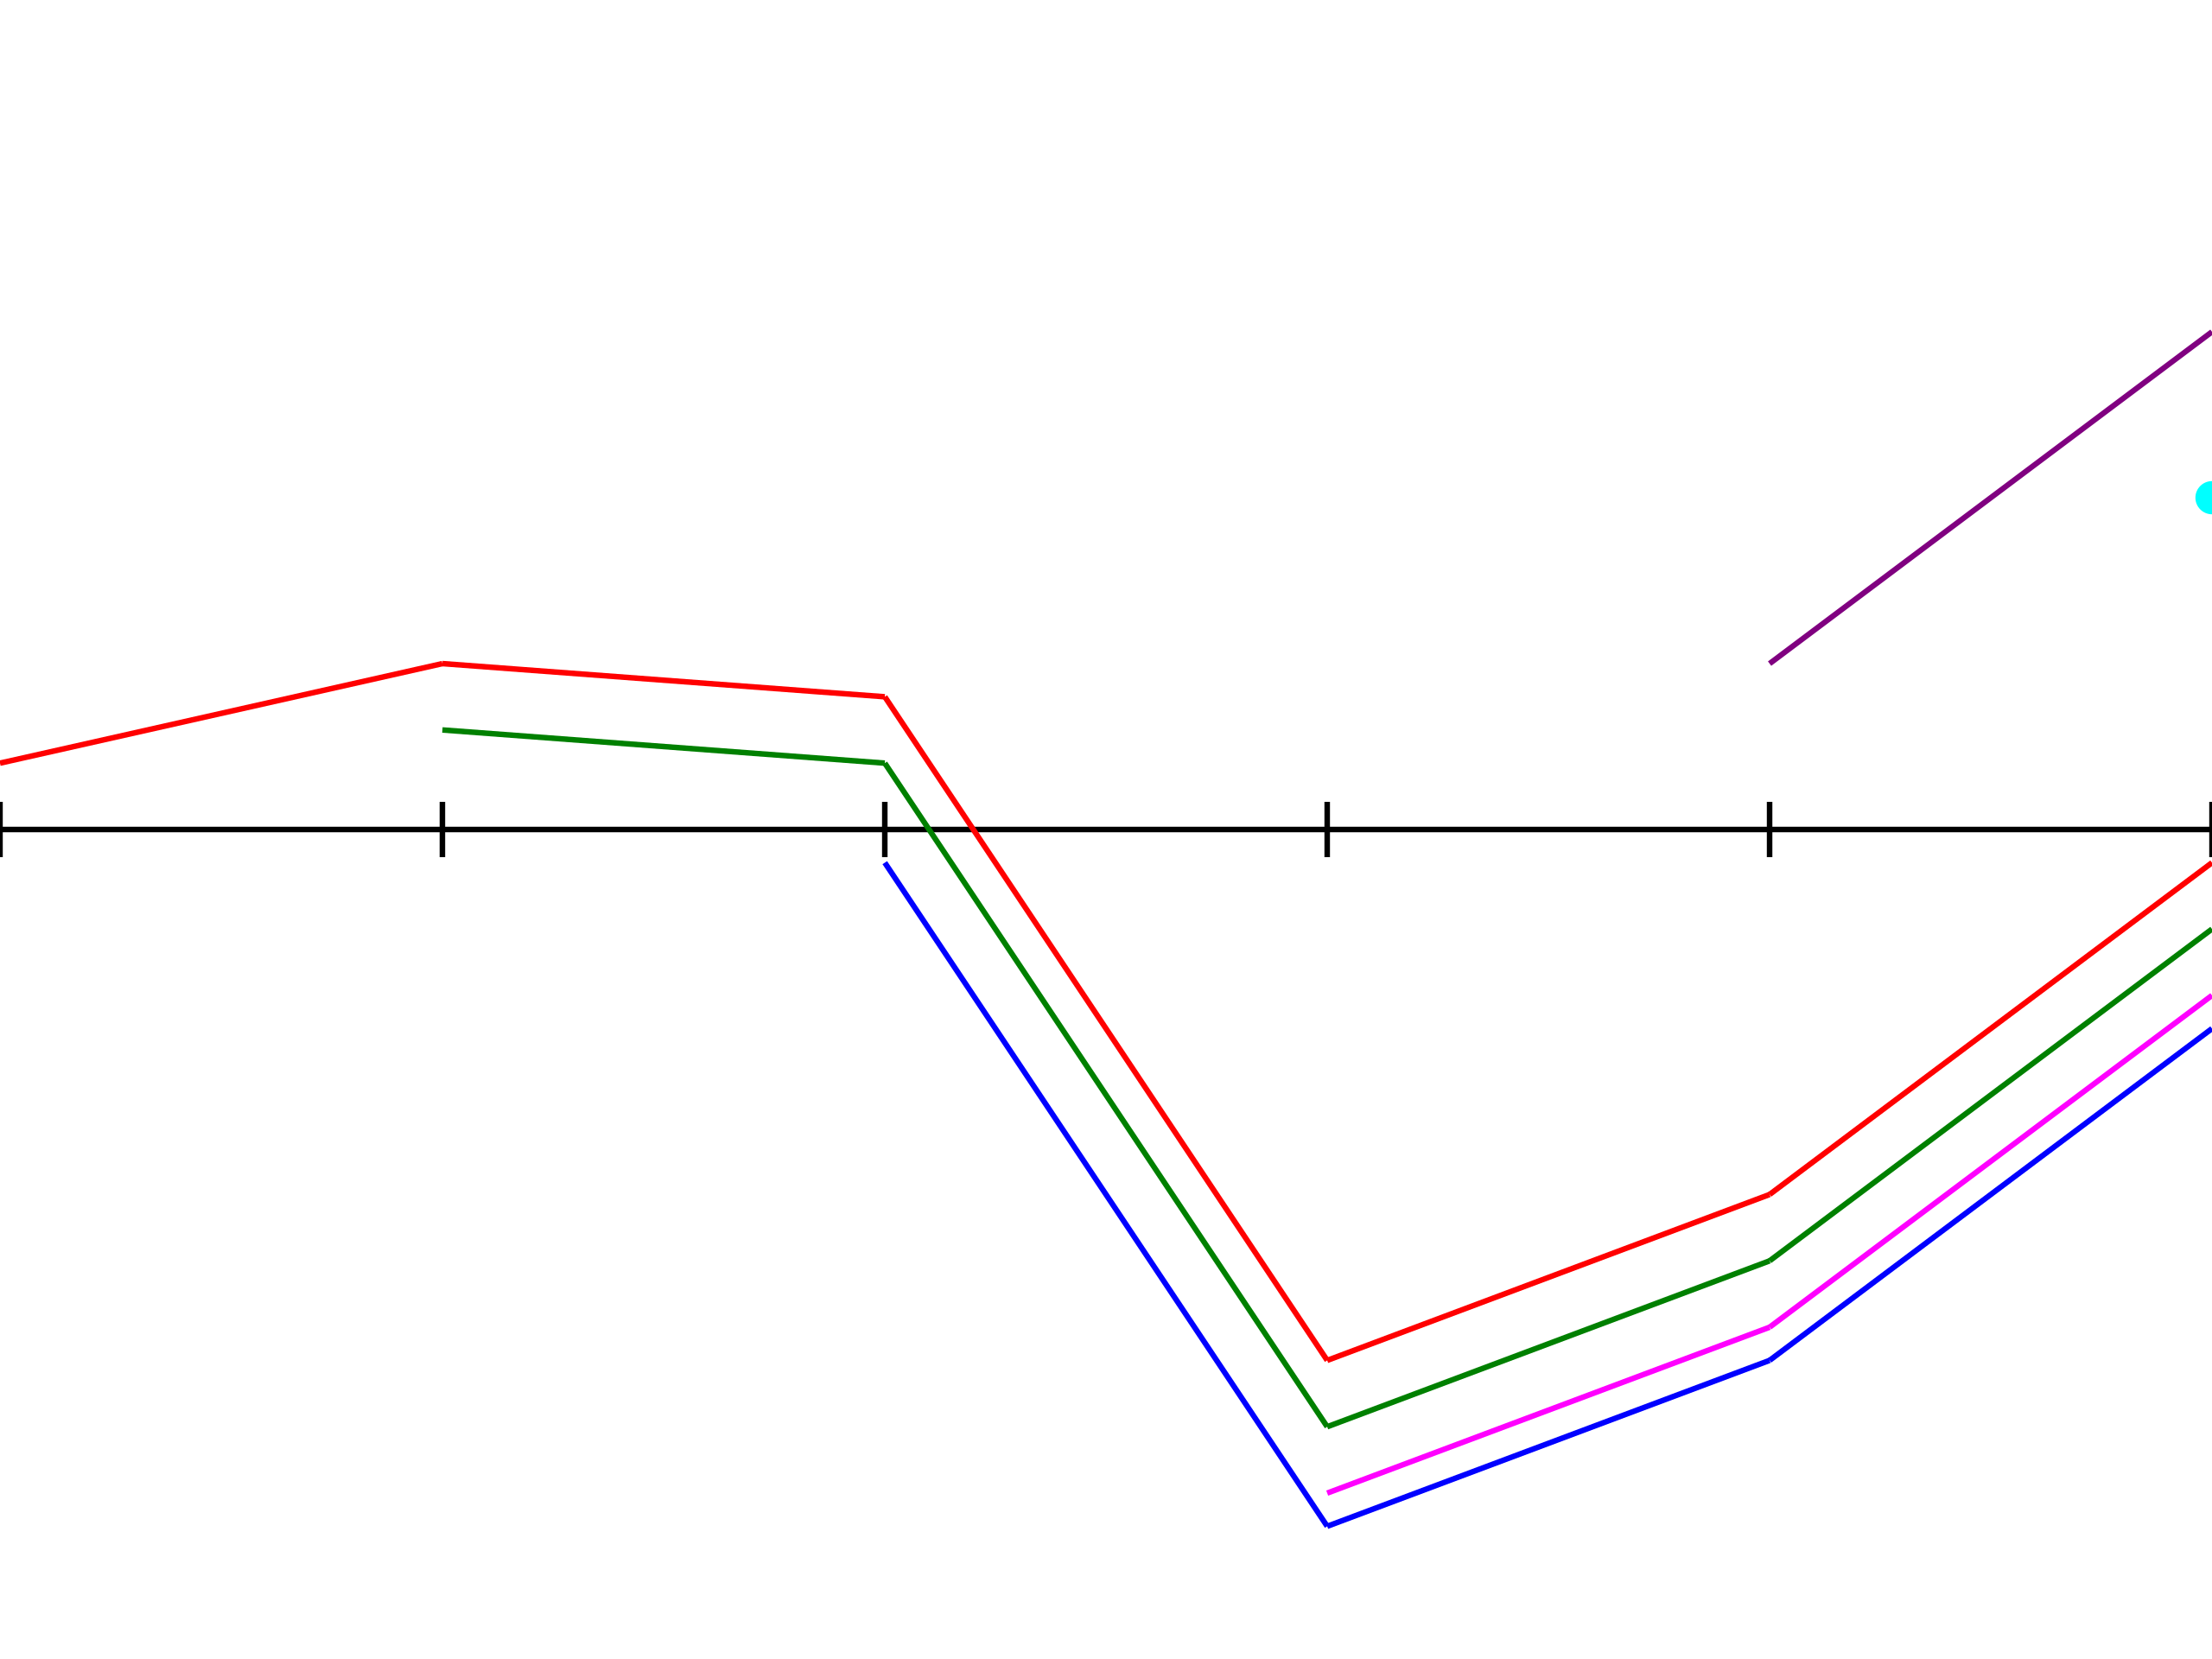
English: Visualization of how sub-arrays change based on start and end positions of a sample. Each possible sub-array is represented by a point on a colored line. That point's y-coordinate represents the sum of the sample, its x-coordinate represents the end of the sample, and the leftmost point on that colored line represents the start of the sample. In this case, the array from which samples are taken is [2, 3, -1, -20, 5, 10]. Created using the svgwrite Python library. |
| 日期 | |
| 来源 | 自己的作品 |
| 作者 | Snydergd |
许可协议
我,本作品著作权人,特此采用以下许可协议发表本作品:
本文件采用知识共享署名-相同方式共享 4.0 国际许可协议授权。
- 您可以自由地:
- 共享 – 复制、发行并传播本作品
- 修改 – 改编作品
- 惟须遵守下列条件:
- 署名 – 您必须对作品进行署名,提供授权条款的链接,并说明是否对原始内容进行了更改。您可以用任何合理的方式来署名,但不得以任何方式表明许可人认可您或您的使用。
- 相同方式共享 – 如果您再混合、转换或者基于本作品进行创作,您必须以与原先许可协议相同或相兼容的许可协议分发您贡献的作品。
文件历史
点击某个日期/时间查看对应时刻的文件。
| 日期/时间 | 缩略图 | 大小 | 用户 | 备注 | |
|---|---|---|---|---|---|
| 当前 | 2016年1月19日 (二) 08:03 | | 400 × 300(2 KB) | wikimediacommons>Snydergd | changed data set to [2, 3, -1, -20, 5, 10], made colored lines not start on 0, changed colors. |
文件用途
以下页面使用本文件: