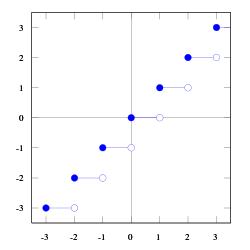
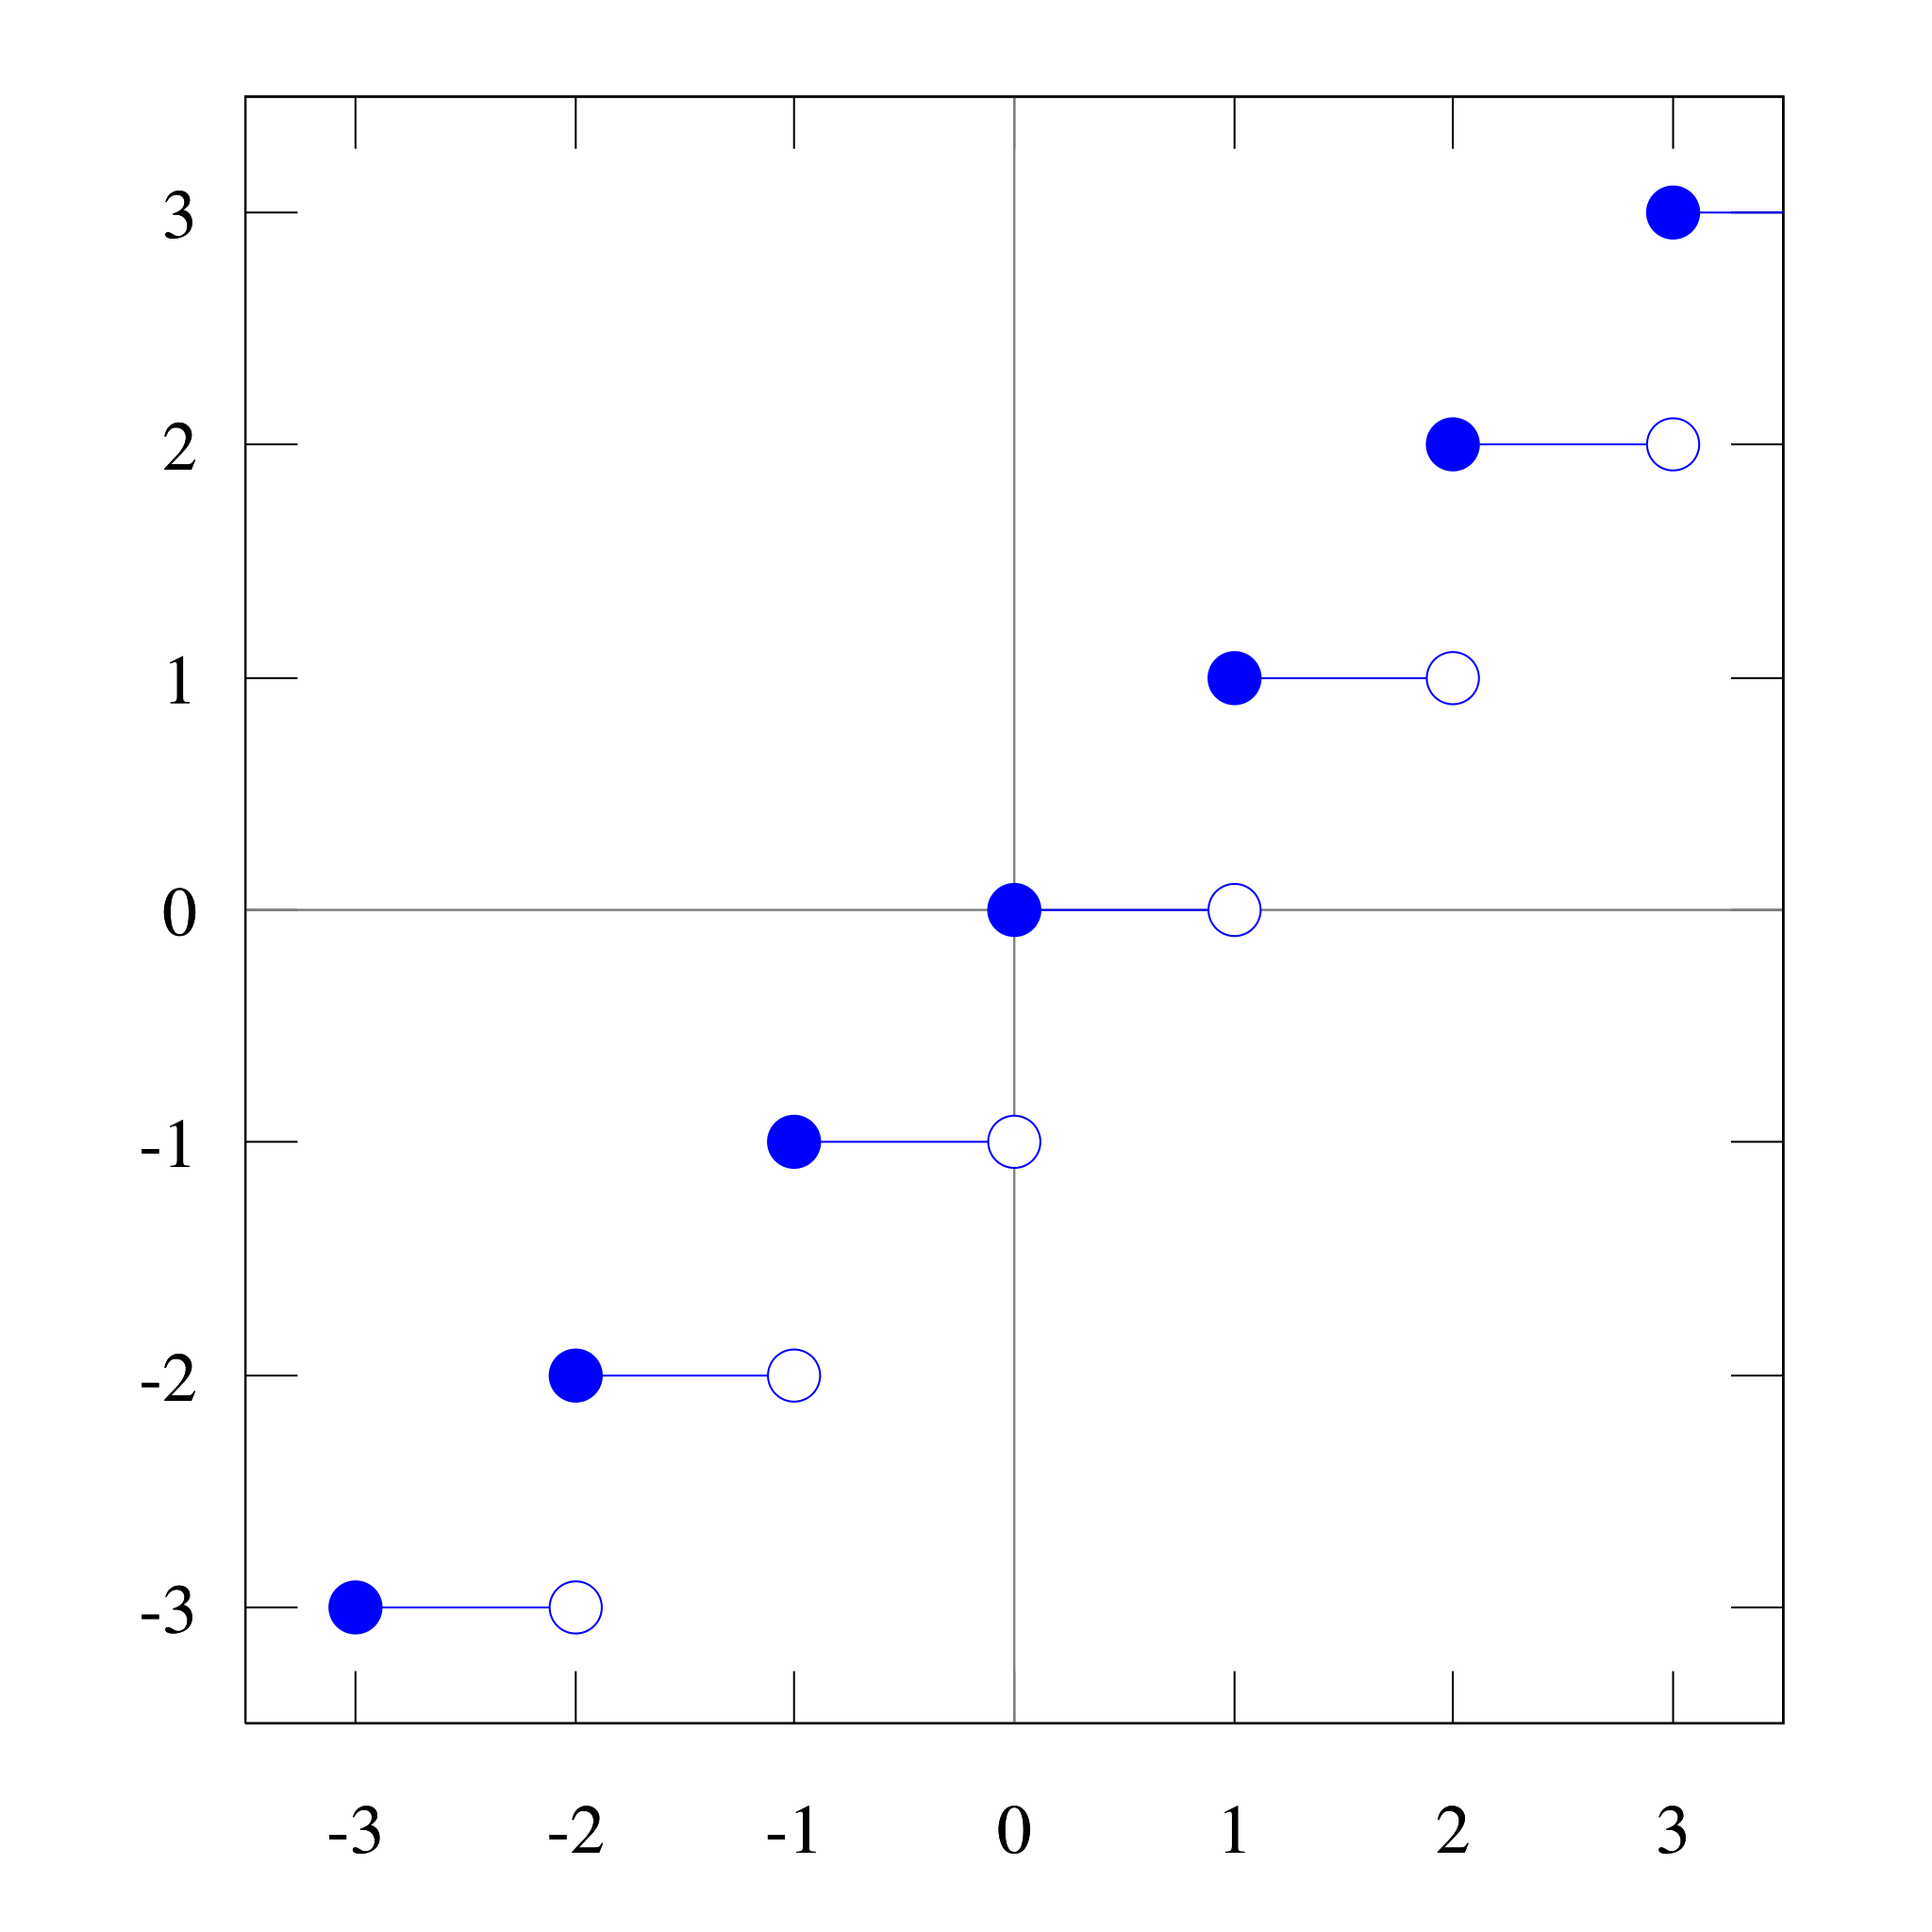
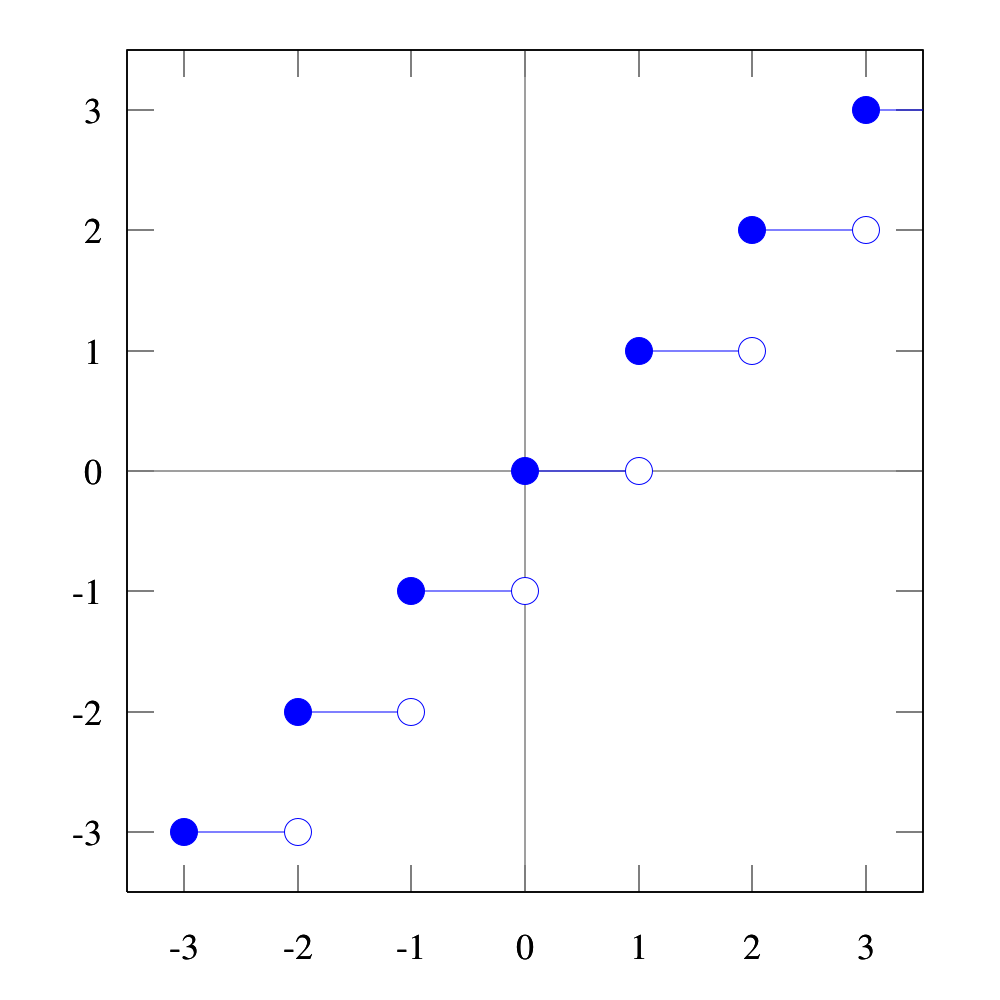
File:Floor function.svg
跳转到导航
跳转到搜索

此SVG文件的PNG预览的大小:600 × 600像素。 其他分辨率:240 × 240像素 | 480 × 480像素 | 768 × 768像素 | 1,024 × 1,024像素 | 2,048 × 2,048像素 | 1,000 × 1,000像素。
原始文件 (SVG文件,尺寸为1,000 × 1,000像素,文件大小:16 KB)
摘要


许可协议
Created by User:Omegatron using gnuplot, possibly with post-processing in the GIMP (PNG) or Inkscape (SVG)
我,本作品著作权人,特此采用以下许可协议发表本作品:
- 您可以自由地:
- 共享 – 复制、发行并传播本作品
- 修改 – 改编作品
- 惟须遵守下列条件:
- 署名 – 您必须对作品进行署名,提供授权条款的链接,并说明是否对原始内容进行了更改。您可以用任何合理的方式来署名,但不得以任何方式表明许可人认可您或您的使用。
- 相同方式共享 – 如果您再混合、转换或者基于本作品进行创作,您必须以与原先许可协议相同或相兼容的许可协议分发您贡献的作品。

|
已授权您依据自由软件基金会发行的无固定段落及封面封底文字(Invariant Sections, Front-Cover Texts, and Back-Cover Texts)的GNU自由文件许可协议1.2版或任意后续版本的条款,复制、传播和/或修改本文件。该协议的副本请见“GNU Free Documentation License”。 |
您可以选择您需要的许可协议。
(In short, this means that you can copy and modify the image freely as long as you provide attribution; preferably in the form of a link back to this page.)
Instructions
See Wikipedia graph-making tips.
 # Set square 1000×1000 SVG output and filename
 # The font size (fsize) sets the size for the circles, too.
 set terminal svg enhanced size 1000 1000 fname "Times" fsize 36
 set output "floor.svg"

 # Set the text value for missing entries in the data file, so we can plot a [[w:discontinuous function|discontinuous function]]
 set datafile missing "Skip"

 # Set y axis limits so the plot doesn't go right to the edges of the graph
 set yrange [-3.5:3.5]
 # Set x axis limits so the first and last points are hidden
 set xrange [-3.5:3.5]

 # No legend needed
 set nokey

 # Add lightly-colored axis lines
 set yzeroaxis
 set xzeroaxis

 # Plot as lines and also points (circles)
 plot "floor.dat" with lines
 plot "floor.dat" with points 1 6

 # Close the file (so I don't have to close gnuplot to view it)
 set output
and data file:
floor.dat
#  X     Y1
   -3    -4
   Skip
   -3    -3
   -2    -3
   Skip
   -2    -2
   -1    -2
   Skip
   -1    -1
   0     -1
   Skip
   0     0
   1     0
   Skip
   1     1
   2     1
   Skip
   2     2
   3     2
   Skip
   3     3
   4     3
Then I opened the resulting SVG file in Inkscape, changed the fill style for the circles (either blue or white fill), brought the plot lines to the top, and then brought the circles to the top (over the lines).
External links
文件历史
点击某个日期/时间查看对应时刻的文件。
| 日期/时间 | 缩略图 | 大小 | 用户 | 备注 | |
|---|---|---|---|---|---|
| 当前 | 2006年5月22日 (一) 01:05 | | 1,000 × 1,000(16 KB) | wikimediacommons>Omegatron | i like blue better |
文件用途
以下页面使用本文件: