File:Decline curve analysis software image of exponential decline - hyperbolic decline.jpg

摘要
| 描述 |
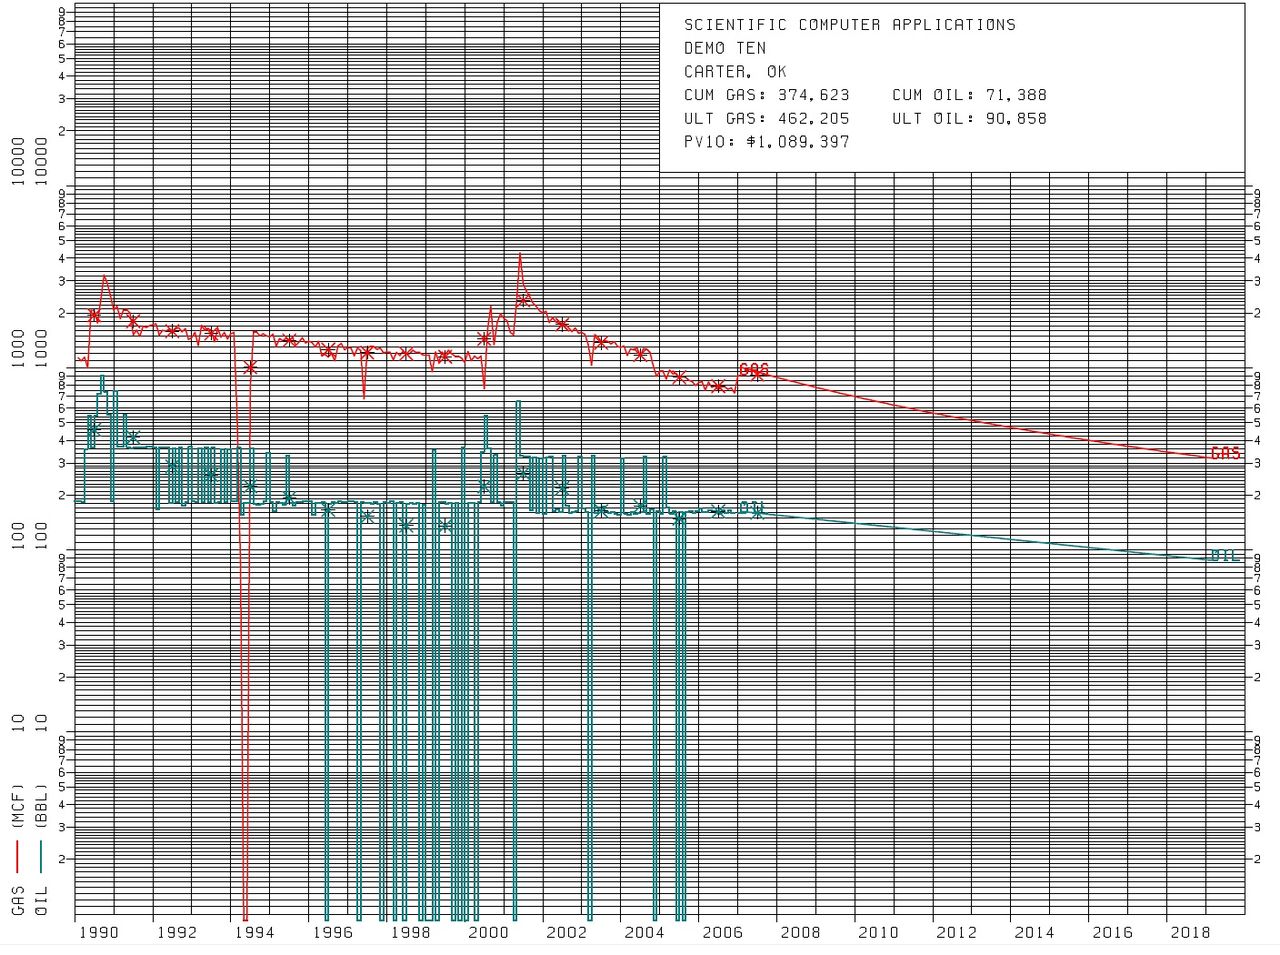
English: Decline curve generated by decline curve analysis software, utilized in oil economics and petroleum economics to indicate the depletion of oil & gas in a Petroleum reservoir.
The Y axis is a semi log scale, indicating the rate of Oil depletion (green line), and gas depletion (red line). The X axis is a coordinate scale, indicating time in years and displays the production decline curve. The top red line is the gas decline curve, which is a hyperbolic decline curve. Gas is measured in MCF (Thousand cubic feet). The lower Blue line is the oil decline curve, which is an exponential decline curve. Oil is measured in BBL, or Oil barrels. Data is from actual sales, not pumped production. The dips to zero indicate there were no sales that month, likely because the Oil well did not produce a full tank, and thus was not worth a visit from a Tank truck. The upper right Legend (map) displays CUM, which is the cumulative gas or oil produced. ULT is the ultimate recovery projected for the well. Pv10 is the Discounted present value of 10%, which is the Future value of the remaining lease, valued for this oil well at $1.089 M USD. |
||
| 日期 | |||
| 来源 | Sent to me personally | ||
| 作者 | Richard Banks | ||
| 授权 (二次使用本文件) |
|

- Other information
许可协议

|
本文件的著作权人,Richard Banks,允许任何人在适当地表明著作权人的姓名的前提下,以任何目的使用本文件。传播,演绎作品,商业用途及所有其他用途被允许。 |
署名:
Screenshot image generated by Forecasting, Economics and Graphics System (FEGS) decline curve analysis software. [1]
|
原始上传日志
本檔案是使用For the Common Good,從en.wikipedia轉移到維基共享資源。
| 日期/时间 | 大小 | 用户 | 备注 |
|---|---|---|---|
| 05:08, 16 May 2012 | 1,408 × 1,050 (681,147 bytes) | w:en:RainmakerUSA (留言 | 贡献) | Decline curve generated by decline curve analysis software, utilized in [[oil economics]] and [[petroleum economics]] to indicate the depletion of oil & gas in a [[Petroleum reservoir]]. The Y axis is a semi log scale, indicating the rate of [[Oil de... |

|
本图像的分类需要调整。 马上检查!
|
文件历史
点击某个日期/时间查看对应时刻的文件。
| 日期/时间 | 缩略图 | 大小 | 用户 | 备注 | |
|---|---|---|---|---|---|
| 当前 | 2014年7月12日 (六) 01:04 | | 1,408 × 1,050(665 KB) | wikimediacommons>Josve05a | Transferred from en.wikipedia: see original upload log above |
文件用途
以下页面使用本文件: