File:Bilininterp.png
跳转到导航
跳转到搜索
本预览的尺寸:750 × 600像素。 其他分辨率:300 × 240像素 | 601 × 480像素 | 1,002 × 801像素。
原始文件 (1,002 × 801像素,文件大小:27 KB,MIME类型:image/png)
摘要
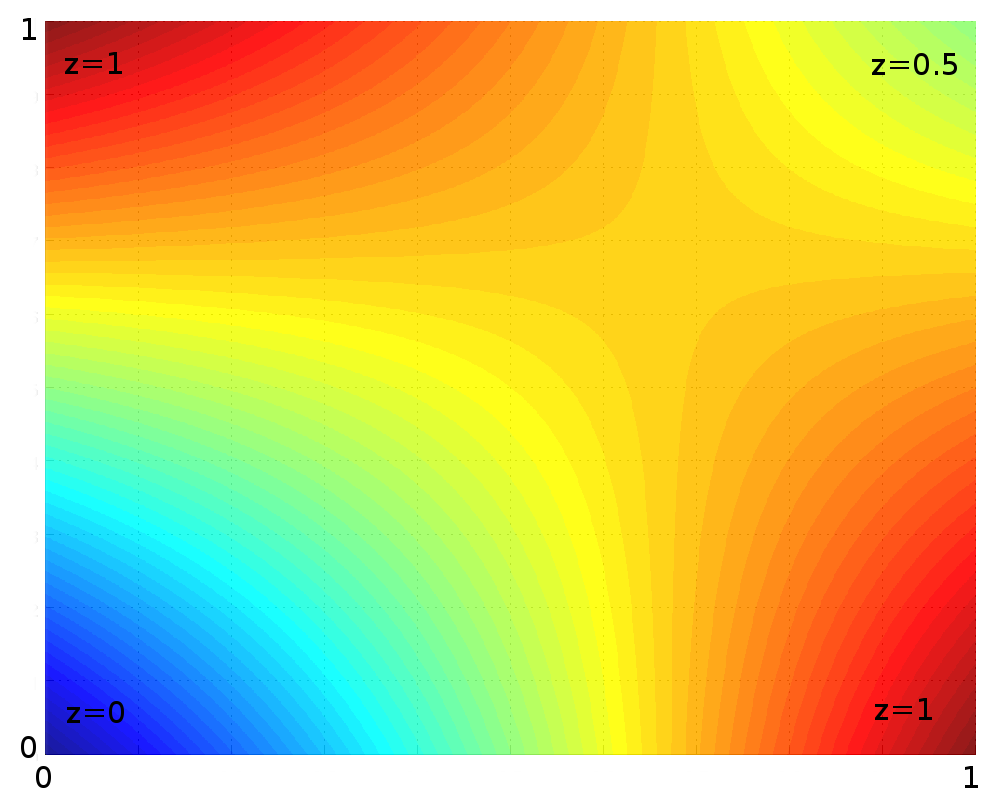
Own work.
Illustrates bilinear interpolation on the unit square. The four corners have fixed values as indicated in the figure, and the values in between are interpolated, and the interpolated values are represented by the colour.
Done in Matlab, source code:
# Grid of known points:
>> [X, Y] = meshgrid(0:1)
# Grid for interpolated values:
>> [XI,YI] = meshgrid(0:0.001:1);
# Known values to interpolate from:
>> Z = [0 1; 1 0.5]
# Do bilinear interpolation
>> ZI = interp2(X,Y,Z,XI,YI);
# Visualize result:
>> surf(XI,YI,ZI, 'EdgeColor','none'); alpha(0.9)
>> view([0 90])
>> print -dpng Bilininterp.png
See also
许可协议
| 我,本作品著作权人,释出本作品至公有领域。这适用于全世界。 在一些国家这可能不合法;如果是这样的话,那么: 我无条件地授予任何人以任何目的使用本作品的权利,除非这些条件是法律规定所必需的。 |
文件历史
点击某个日期/时间查看对应时刻的文件。
| 日期/时间 | 缩略图 | 大小 | 用户 | 备注 | |
|---|---|---|---|---|---|
| 当前 | 2023年6月30日 (五) 10:12 | | 1,002 × 801(27 KB) | wikimediacommons>Phreneticc | Reduced file weight with FileOptimizer in lossless compression mode. |
文件用途
以下页面使用本文件: